
Editorial charts for an article published on the Council on Foreign Relations on the return of measles as vaccination coverage weakens in different parts of the world.
Full article ↗I designed a set of editorial charts for an article examining the resurgence of measles, tracing the breakdown from global geography to regional disruptions in vaccination coverage and, ultimately, the recent spike in U.S. cases.
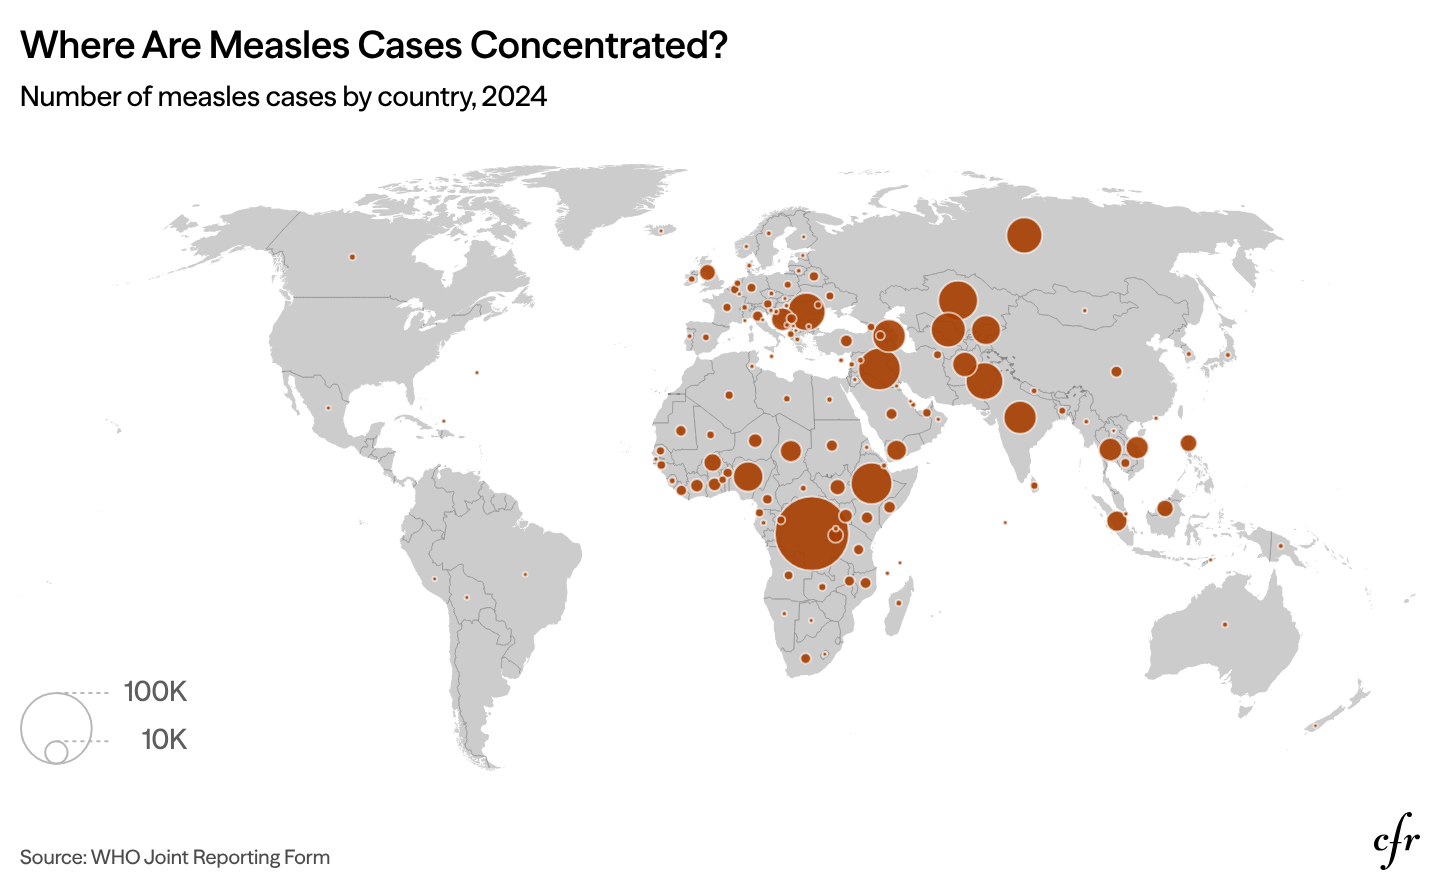
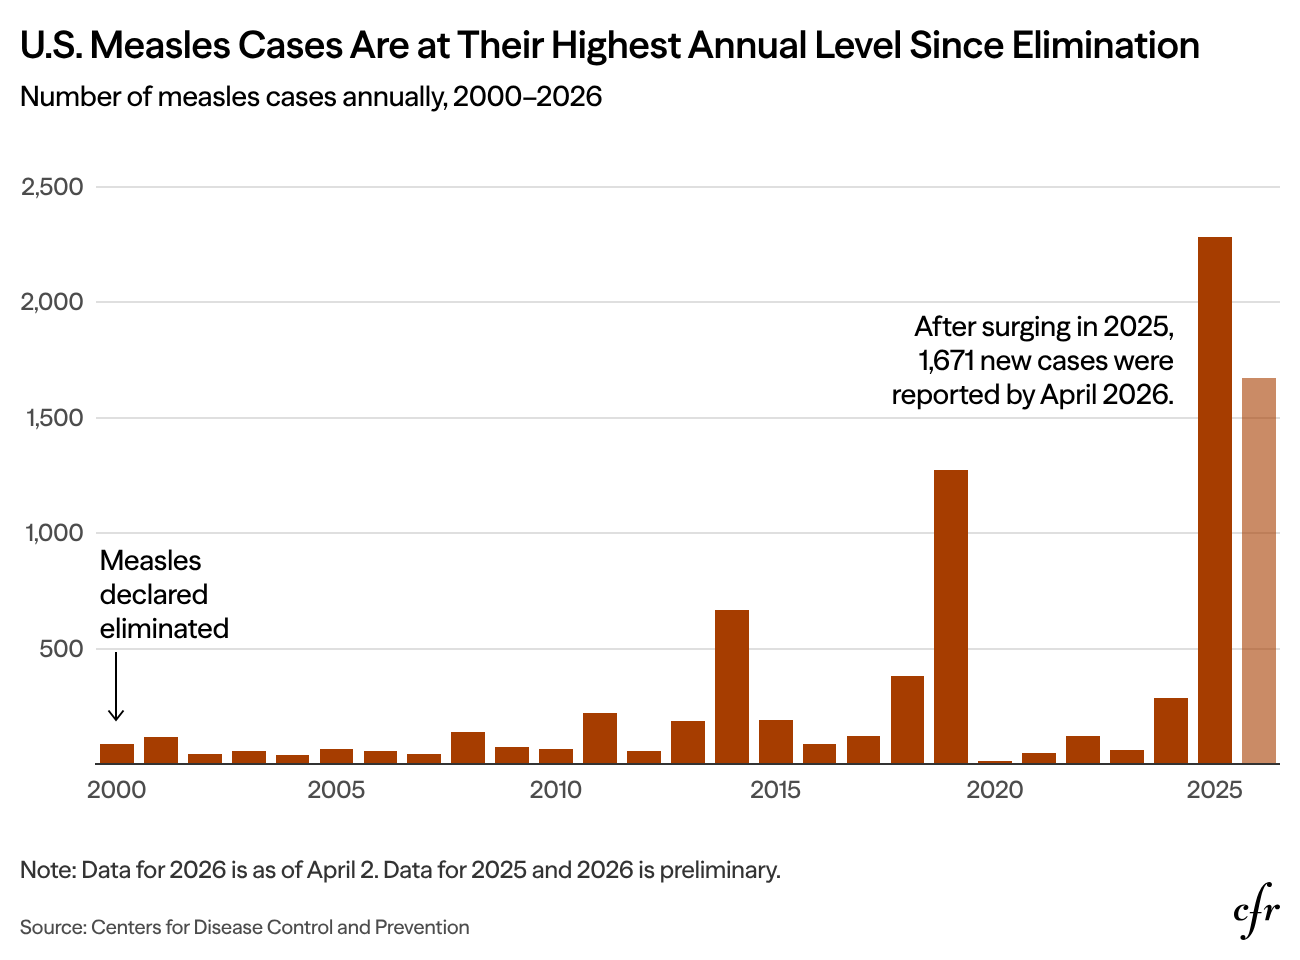
The charts move across these scales: a bubble map for the global concentration of outbreaks, a regional line chart to show long-run disruption, and a bar chart to trace the renewed rise of U.S. cases.
The focus was on building a coherent visual language across very different datasets and levels of analysis, so the visuals read as a sequence rather than a collection.